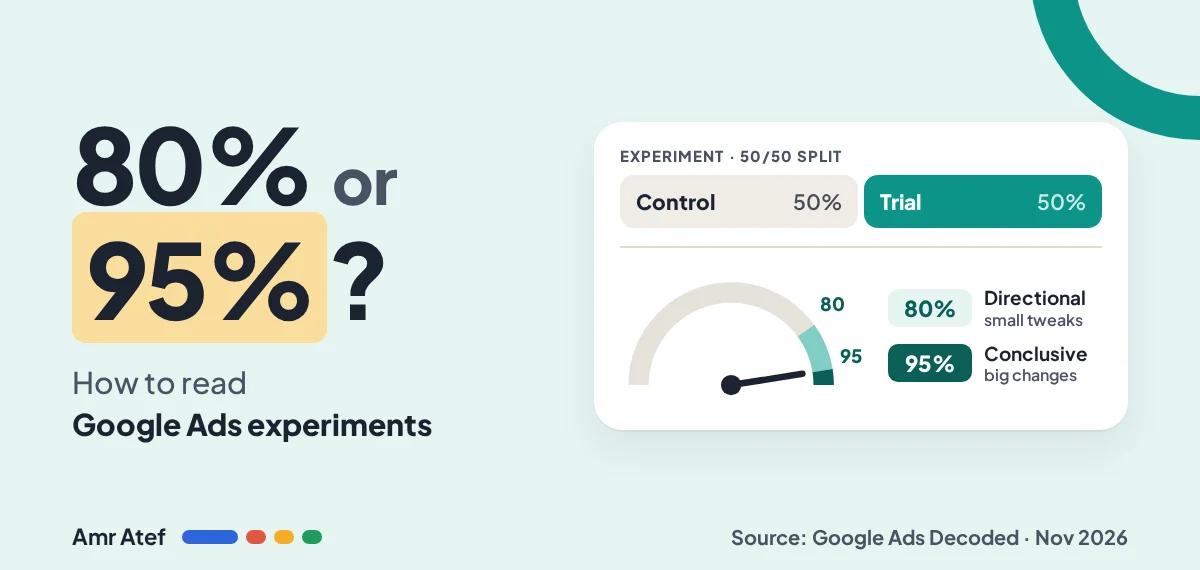
Google just told you 80% confidence is good enough. That’s true for some tests, and it’s an expensive mistake for others. On November 19, 2026, Google’s Ads & Commerce Blog summed up an Ads Decoded episode on Google Ads experiments in three rules, and the third one is the one everybody is quoting: 80% for directional tweaks, 95% for major structural overhauls. Google didn’t say which changes belong in which bucket. This article is my answer to that, as a media buyer who has to defend the result to whoever pays the bill.
Quick answer: Use 80% confidence when the change is small, cheap to undo and limited to the campaigns you tested, like a new headline set or a small tCPA move. Use 95% when the change is hard to reverse or will be rolled out wider than the test, like switching bid strategy, turning AI Max on across the account or merging campaigns. In both cases, test one variable on a 50/50 split, judge it on a business metric chosen before launch, and give it 4 to 6 weeks.
- 80% is the default confidence level in the Experiments scorecard, and you can change it.
- “Not statistically significant” means “we can’t tell yet”, not “it made no difference”.
- A test that runs through Black Friday measures Black Friday, not your change.
What Did Google Say About Google Ads Experiments?
The Google blog post is short. Ads Product Liaison Ginny Marvin talks with product leads Sagar Shah and Al Nevarez about using A/B tests to validate AI Max features, budget shifts and Smart Bidding strategies. The post boils it down to three rules:
- Start with templated setups. Pre-built templates isolate a single variable, split traffic 50/50 and reduce setup errors.
- Focus on business outcomes. Measure qualified conversions, not shallow proxies, and give tests four to six weeks to account for conversion lag.
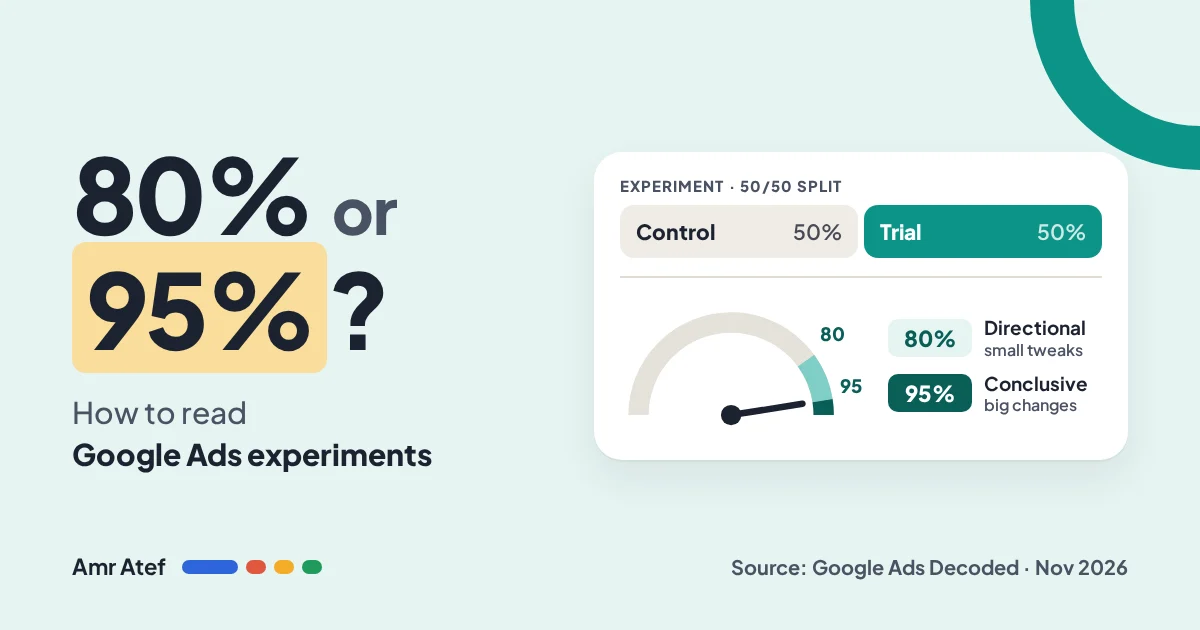
- Match confidence to decision scope. An 80% confidence interval works for directional tweaks. Reserve 95% for major structural overhauls.
Two details from the full episode, as reported by PPC Land, sharpen the third rule. Marvin said Google now offers 80%, 85% and 95% levels. And Nevarez said that if you plan to apply the result to campaigns that weren’t in the test, you may want to be stricter and use 95%. That second point is the most useful sentence in the whole episode, and it’s the backbone of my framework below.
One honest note before we go on: Google’s own pages don’t fully agree with each other. The Monitor your experiments page says 80% is the default and you can pick your own level, but it also recommends running for 2 to 3 weeks, not 4 to 6. The statistical methodology page says significance testing is run at 95%. Go with the longer test length. Short tests are where most bad decisions come from.
What Does 80% Confidence Mean in a Google Ads Experiment?
Google Ads experiments compare a control arm (the campaign as it is) with a treatment arm (the campaign with your change). The scorecard shows the difference between them, say +10% conversions, and a range around it called the confidence interval: the band where the real difference probably sits.
The confidence level sets how wide that band is. At 80%, the band is narrower, so you reach a verdict sooner. The price: by the standard definition, an 80% interval misses the true effect about 1 time in 5. At 95%, it’s about 1 time in 20, but you need more data to get there.
Put in money terms: at 80%, roughly one “winner” in five you apply could be noise. For a headline swap, that’s a cheap mistake you’ll catch next month. For moving your whole account to a new bid strategy, it’s a quarter of wasted budget.
Google uses jackknife resampling on bucketed data (20 buckets per arm) to calculate these intervals. In plain words: it recalculates the result many times, leaving out a slice of traffic each time, so one unusual user who converts ten times can’t fake a winner on their own.
Directional vs Structural: Which Confidence Level for Which Change?
This table is my view, not Google’s. Google gave the two labels; the examples, the thresholds and the test lengths below are how I’d apply them. My rule underneath it: if the change is cheap to undo and stays inside the tested campaigns, it’s directional. If it’s hard to undo, or you’ll roll it out beyond the test, it’s structural.
| Change you’re testing | Type | Confidence level | Minimum test length |
|---|---|---|---|
| New headlines, descriptions or assets in one campaign | Directional | 80% | 4 weeks |
| Small tCPA or tROAS change (around 10 to 20%) | Directional | 80% | 4 weeks |
| Landing page variant for the same offer | Directional | 80% | 4 weeks |
| Modest budget increase on one campaign | Directional | 80% | 4 weeks |
| Switching bid strategy (Manual CPC to tCPA, tCPA to tROAS) | Structural | 95% | 6 weeks + conversion lag |
| Turning AI Max on account-wide | Structural | 95% | 6 weeks + conversion lag |
| Merging campaigns or a PMax consolidation | Structural | 95% | 6 weeks + conversion lag |
| Big budget reallocation between campaigns | Structural | 95% | 6 weeks + conversion lag |
| Changing the conversion goal you optimise for (form fill to qualified lead) | Structural | 95% | 6 weeks + conversion lag |
Let’s use an example. This one is hypothetical. A Dubai real estate developer runs a Search campaign for “apartments for sale in Dubai” on tCPA. Testing a tCPA of AED 300 against AED 340 is directional: if the 80% “winner” turns out to be noise, you nudge the target back next month and lose little. Testing tCPA against tROAS based on qualified lead values is structural: it changes what the algorithm chases, takes weeks to settle, and if it wins you’ll want to roll it out to every project campaign. That one waits for 95%.
A few notes on the structural rows. Google’s AI Max for Search template, per Nevarez, covers text customization and final URL expansion at campaign level; if you’ll apply the winner to campaigns outside the test, that’s exactly the case he said deserves 95%. If you’re turning on final URL expansion, set your AI Max URL exclusions in both arms before launch. And for consolidation, remember that a custom experiment splits one campaign against a copy of itself, so it can’t compare a Search campaign with a PMax campaign. For that, use the Performance Max uplift experiment or run both side by side.
Video is its own world. Google’s video experiments page lets you see directional results from 70%, calls 80% still directional, and treats 95% at completion as conclusive. Demand Gen A/B experiments use the same three levels, with 70% as the default. Don’t carry the Search defaults into those reports without checking the label.
How to Set Up Google Ads A/B Testing You Can Actually Read
Most “inconclusive” Google Ads experiments I see were decided at setup, not at the end. Here’s the order I’d follow:
- Write the hypothesis in one sentence. “Switching to tROAS will increase qualified lead value at the same spend.” If you can’t write it, you’re not ready to test.
- Change one variable. Google’s experiments guide gives the example: test two headlines but also two bid strategies, and you’ll never know which one won. Templates enforce this for you.
- Use a 50/50 split. Templates split traffic inside the same campaign instead of copying it, which Nevarez said reduces setup errors and can shorten the learning period. Google applies the split to eligible auctions before targeting, so both arms enter the same number of auctions.
- Pick the primary metric before launch. One or two metrics, tied to the business: qualified leads, conversion value, cost per qualified lead. Not CTR. If your conversion tracking only counts form fills, fix that first, because the test will optimise for and judge on the wrong thing.
- Make sure there’s enough volume. Google’s video experiments won’t report conversion results until each campaign has at least 100 conversions. Google doesn’t publish a Search equivalent, but I’d treat a similar figure per arm as a sensible floor. Low volume? Add more campaigns to the same test; Nevarez said multi-campaign experiments give more statistical power.
- Don’t touch it mid-test. Google’s own advice: avoid changes to base campaigns unless sync is on. Sync is on by default for custom Search and Display experiments and can only be set at the start, per the episode.
- Check auto-apply. For some experiment types, auto-apply of favourable results is on by default. For a structural test, I’d turn it off and make the call myself.
One budget detail worth knowing. In the new budget test, as Nevarez described it, a campaign on AED 100 a day testing AED 150 runs its control arm on 50 and its treatment arm on 75. Don’t panic when the daily total looks odd during the trial.
How to Read Google Ads Experiments Results
Confidence interval vs p-value
The Experiments scorecard doesn’t show you a p-value. It shows the difference (for example +10% conversions), an interval like [+8%, +12%], and a blue asterisk when the result is statistically significant. The interval is the more useful of the two: a p-value only tells you whether there’s probably some difference, while the interval tells you how big it could be.
The quick read: if the whole interval sits above zero, the treatment is ahead at your chosen confidence level. If it crosses zero, like [-3%, +15%], you don’t have a verdict yet. Switch the level in reporting from 80% to 95% and watch the interval widen. That’s the same data, asked a stricter question.
“Not significant” doesn’t mean “no effect”
Google’s monitoring page lists the usual reasons a result isn’t significant: the test hasn’t run long enough, the campaign doesn’t get enough traffic, the split was too small, or the change really made no difference. Only the last one means “no effect”. Shah put it simply in the episode: a non-significant result says you see a difference, but you can’t tell it from noise.
Before you call a flat test, Nevarez’s checklist from the episode is a good one: confirm conversion tracking, check it ran 4 to 6 weeks, check whether the treatment arm was budget-limited, look at secondary metrics, and review the search terms report for junk traffic in the treatment.
Conversion lag
If your leads convert a week or two after the click, the last days of any test are incomplete. Shah’s schedule in the episode: about a week of ramp-up, four to five weeks of measurement, then end the test and wait for delayed conversions before comparing. Judging on day 1 after the end date will usually understate whichever arm drove more recent clicks.
Common Mistakes With Google Ads Experiments
- Ending at week 2. The treatment is “winning” at 80% after 14 days, so you apply it. With conversion lag and a learning period, that early lead often disappears. Wait for the full window.
- Judging on CTR or CPC. Marvin raised this one herself: CPCs rise in a Smart Bidding test and people call it a failure, even when CPA hit target. Paying more per click to reach people who convert can be the point.
- Testing through Black Friday. Black Friday is November 27, 2026 and Cyber Monday is November 30. A test that starts mid-November and spans that period measures a holiday spike in both arms, then a post-holiday drop. For structural tests, I’d launch after the peak settles. Seasonality is the same reason I covered prep timing in my Demand Gen Black Friday article.
- Running overlapping experiments. Two tests on the same campaign, or a bid strategy test on campaigns that share budget with another test, contaminate each other. One test per campaign at a time.
- Applying 80% winners account-wide. A directional win on one campaign is a hint, not proof for twenty others. Roll out in stages, or retest at 95%.
If you want the basics of split testing outside Google Ads, my older guide to A/B testing covers the general idea.
Pre-Launch Checklist
- Hypothesis written in one sentence.
- Each of your Google Ads experiments labelled directional (80%) or structural (95%) before launch.
- One variable changed. Template used where one exists.
- 50/50 split.
- Primary metric is a business outcome, and tracking for it is verified.
- Enough expected conversions per arm, or more campaigns added.
- 4 weeks booked for directional, 6 weeks plus conversion lag for structural.
- Test window avoids Black Friday to Cyber Monday and other known spikes.
- No other experiment touching the same campaigns or budgets.
- Sync and auto-apply set on purpose, not by default.
More From the Blog
- AI Max URL Exclusions: How Google’s Token Matching Really Works
- Search Journey Awareness: How Smart Bidding Learns From Your Whole Funnel
- Google Ads Conversion Tracking
- Demand Gen Campaigns: Updates Before Black Friday
- The Google Ads Search Terms Report
Frequently Asked Questions
What is the default confidence level in Google Ads experiments?
80%. Google’s Monitor your experiments page says 80% is the default confidence interval and that you can pick your own level in reporting.
When should I use 95% confidence instead of 80%?
Google says to reserve 95% for major structural overhauls. In my view that means changes that are hard to undo or that you’ll roll out beyond the tested campaigns, such as a new bid strategy, AI Max across the account or a campaign merge.
How long should a Google Ads experiment run?
Google’s November 19, 2026 blog post recommends four to six weeks to account for conversion lag. Google’s monitoring help page suggests 2 to 3 weeks, but longer tests give more reliable results.
Does “not statistically significant” mean my change had no effect?
No. It can mean the test was too short, had too little traffic or used too small a split. Only when those are ruled out does it suggest the change made no real difference.
Can I compare a Search campaign and a Performance Max campaign in one experiment?
Not with a custom experiment, because it splits one campaign against a copy of itself. Use the Performance Max uplift experiment, or run both at the same time and compare.
What confidence levels do video experiments use?
Google treats video experiment results at 70% and 80% as directional and at 95% on completion as conclusive.
Sources
- How to build strategic A/B tests, Google Ads & Commerce Blog, November 19, 2026
- Monitor your experiments, Google Ads Help
- The statistical methodology behind experiments, Google Ads Help
- Test with confidence with the Experiments page, Google Ads Help
- Monitor the performance of a video experiment, Google Ads Help
- Create A/B experiments for Demand Gen campaigns, Google Ads Help
- Google says 80% confidence is good enough for directional ad tests, PPC Land, November 19, 2026
What’s the last test you applied at 80% that you’d now want to see at 95%? Tell me on LinkedIn, and subscribe on YouTube for more Google Ads breakdowns.
About the author: Amr Atef is a Dubai-based performance marketing specialist focused on Google Ads and marketing technology, and the builder of BenaAds. He writes a practical Google Ads series for new advertisers. Follow him on LinkedIn and YouTube, or read more about Amr.
